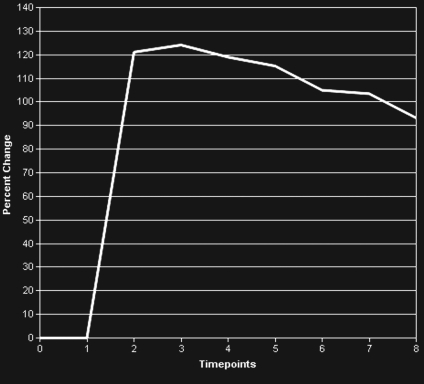
Figure 3d.
BPH on endorectal MR images obtained at 1.5 T. (a) Axial T2-weighted image (6000/92) shows well-defined heterogeneously bright hyperplastic nodules in the central prostate. Note the discrete dark margins of the junction of the central gland and the peripheral zone pseudocapsule (arrows). (b) Color map from computer-assisted diagnosis analysis of DCE MR imaging data shows a region of interest (ROI) marking the left hyperplastic nodule of BPH. (c) Permeability histogram shows a wide range of permeability values for tissue in the ROI. (d) Kinetic curve (percentage of enhancement over time) from DCE MR imaging data shows a washout pattern of enhancement in the BPH tissue included in the ROI. In this case, the morphologic features at T2-weighted imaging are more specific for the diagnosis of BPH than are the results of kinetic curve analysis, which may suggest malignancy. (e) Image from MR spectroscopy shows a voxel grid overlay over the T2-weighted image (left); the spectral display (right) shows normal spectra in the region of BPH. For example, the spectrum for the selected voxel (arrow) shows a high citrate (Ci) peak and a low choline (Ch) peak in the benign tissue of BPH. Ch + Cr/Ci = 0.297, where Cr = creatine.

