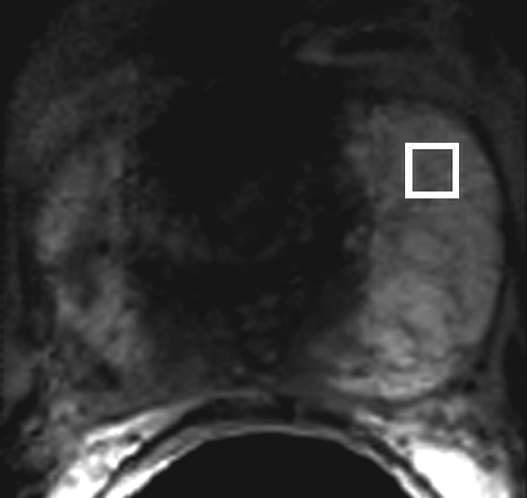
Figure 5a.
Prostate cancer in a 43-year-old man with a Gleason score of 4 + 3 and a PSA level of 90.5 ng/mL. Endorectal MR imaging was performed at 3.0 T. (a) T2-weighted image (4860/109) shows a voxel of interest (square) in the left peripheral zone. Although the left peripheral zone is enlarged compared with the right peripheral zone, it has no focal dark areas. There are patchy dark abnormalities in the right peripheral zone. (b) MR spectroscopic spectrum from the voxel of interest shows a markedly elevated level of choline (Cho) (arrow) that is almost equal to the citrate (Ci) peak. Elevation of choline level with a decrease in citrate level is the spectral signature of prostate cancer. Cr = creatine. (c) Color DCE MR map shows a large area of high permeability (Ktrans) occupying the entire left peripheral zone (arrows). (d) Axial image from a SPECT study with 111In-labeled prostate monoclonal antibody (capromab pendetide [ProstaScint; Cytogen, Princeton, NJ]) shows avid uptake in the entire left prostate (arrow), a finding compatible with a large-volume prostate cancer. As seen in this case, some aggressive prostate cancers, even of large volume, may appear isointense on T2-weighted images; thus, morphologic imaging alone may not be able to show these tumors. Functional MR imaging—MR spectroscopy and DCE MR imaging—as well as antibody imaging accurately depicted this large prostate cancer.

