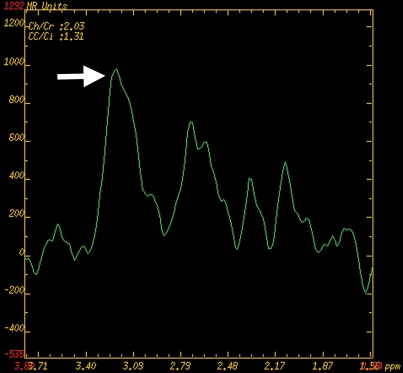
Figure 6f.
Prostate cancer of the transition zone in a 52-year-old man with a Gleason score of 3 + 4 and a PSA level of 19 ng/mL. Endorectal MR imaging was performed at 1.5 T. (a) Axial T2-weighted image (6000/92) shows ill-defined homogeneous dark infiltration of the central gland (arrows). (b) Sagittal T2-weighted image (3350/92) shows homogeneous dark tissue replacing the central gland (arrows). (c) Axial color DCE MR map shows a large area of high permeability (Ktrans) (red areas) in the transition zone. (d) Permeability histogram shows a shift toward high permeability values, a finding characteristic of cancer. (e) Kinetic curve (percentage of enhancement over time) shows typical washout pattern in the transition zone tumor. (f) MR spectroscopic spectrum from the transition zone tumor shows a high choline (Cho) peak (arrow) at 3.2 ppm that is above that of citrate (Ci) at 2.64 ppm. Cho + Cr/Ci = 1.31, where Cr = creatine; this value is typical of prostate cancer. (g) Ex vivo T2-weighted image (4700/42) of the specimen, obtained at 9.4 T, shows highly cellular, compact dark tissue in the central gland (arrows) surrounding the urethra (U). (h) Photograph of a whole-mount reconstructed histologic section (original magnification, ·2; hematoxylin-eosin [H-E] stain) of the midgland shows a large volume of tumor in the transition zone (outlined in green). Note the excellent correlation with the ex vivo image in g and the in vivo image in c, which show cancer of high cellular density in the transition zone. (i) Photomicrograph of a histologic section (original magnification, ×40; H-E stain) from the transition zone tumor shows loss of gland units and sheets of cancer cells with randomly scattered lumina. Note the muscular stroma component between the tumor cells.

