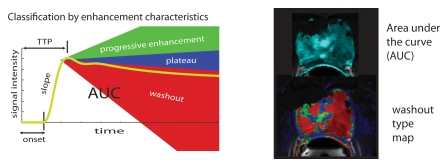
Figure 10b.
Synopsis of DCE MR imaging. (a) Use of the TKCM. Repeated imaging before and after administration of contrast material is performed. ROI analysis of the input artery (top) and voxel-wise analysis of the prostate (bottom) yield the arterial input function and voxel-wise time-concentration curves. Mathematical deconvolution is used to recover the tissue response h(t), from which the TKCM parameters can be estimated. Parametric maps are generated by color-coding ranges of TKCM parameters according to nomograms. kep = efflux rate constant, Ktrans = influx transfer constant, ve = leakage space. (b) Heuristic parameters are illustrated for a tissue time–signal intensity curve. These include onset time, slope, time to peak (TTP), washout characteristics (progressive enhancement, plateau, and washout), and area under the curve (AUC). Parametric maps are pseudocolored to facilitate recognition of suspicious parameter values.

