Figure 4.

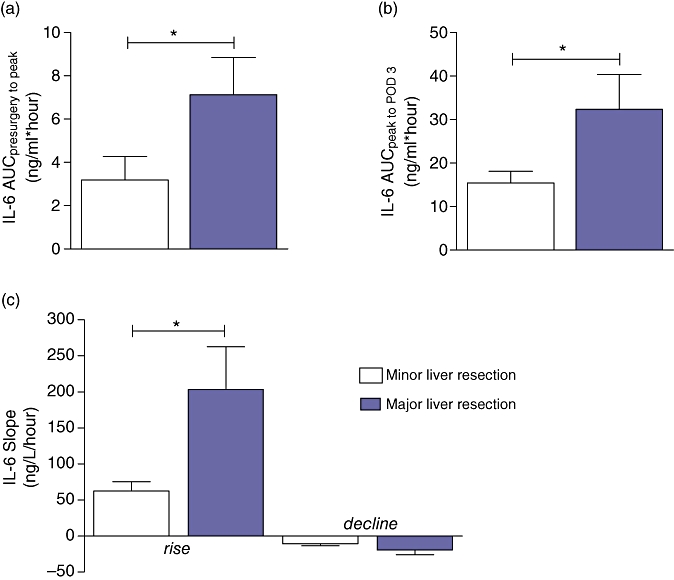
(a) Area under curvepresurgery to peak, (b) area under curvepeak to POD3 and (c) sloperise in patients who underwent major vs. minor liver resection. Data are means ± SEM. *Significant difference (P < 0.05)

(a) Area under curvepresurgery to peak, (b) area under curvepeak to POD3 and (c) sloperise in patients who underwent major vs. minor liver resection. Data are means ± SEM. *Significant difference (P < 0.05)