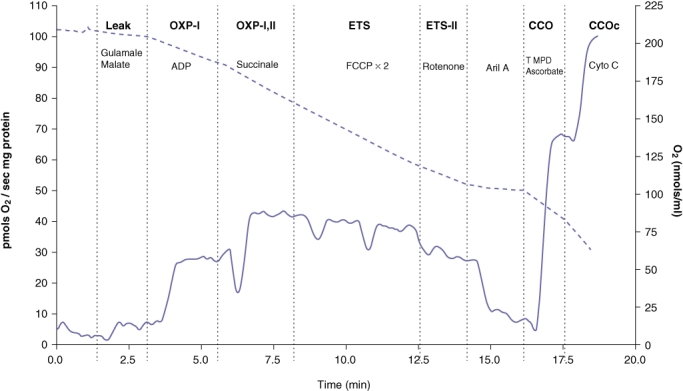
Figure 1.

Representative trace generated by the OROBOROS® Oxygraph 2 K. Solid line represents mitochondrial respiration (left y-axis) and the dotted line represents the oxygen concentration (right y-axis). LEAK: state 2 respiration with glutamate and malate. OXP-I: oxidative phosphorylation with Complex I substrates (state 3 respiration) with the addition of adenosine diphosphate (ADP). OXP-I,II: state 3 respiration with succinate a Complex II substrate. ETS-I,II: uncoupled respiration with addition of carbonylcyanide-4-(trifluoromethoxy)-phenylhydrazone (FCCP). ETS-I,II: addition of rotenone. CCO: addition of tetramethyl-p-phenylenediamine (TMPD)/ascorbate. CCOc addition of cytochrome C. Cyto C: cytochrome C. Ant A: antimycin A. Concomitant oxygen concentration (nmol/ml) is shown on the right y-axis
