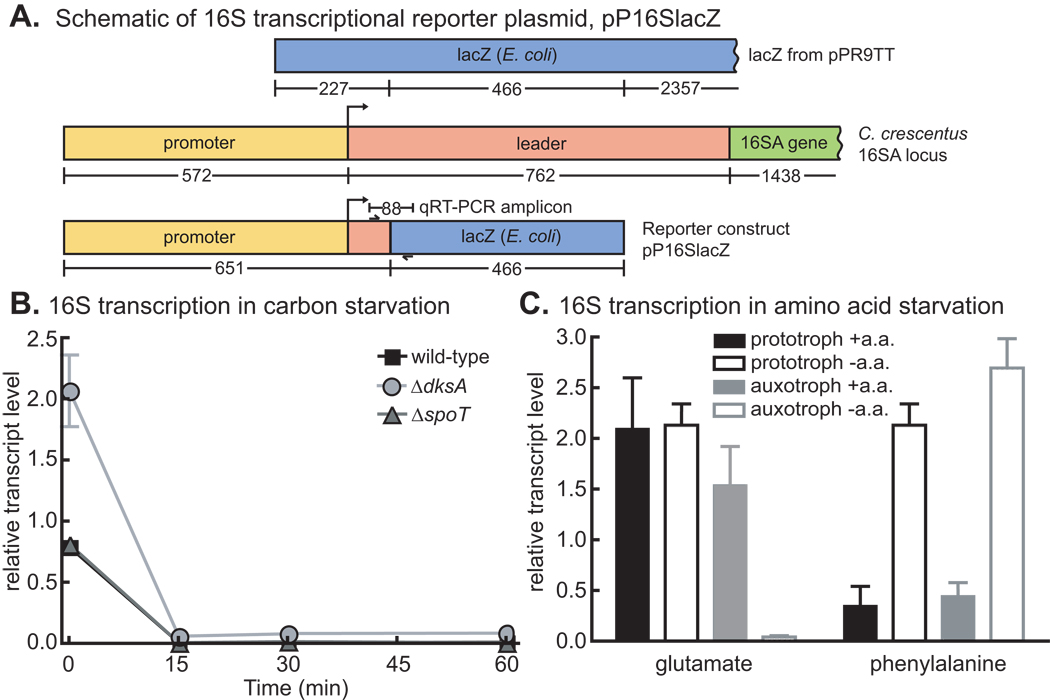
Figure 7. rRNA transcriptional control.
A) Schematic of 16S transcriptional reporter plasmid, which produces an unstable transcript from the 16S A rRNA promoter. Numbers below genes represent the number of nucleotides. Location of qRT-PCR amplicon primers are indicated by small arrows. B) 16S rRNA promoter activity in wild-type, ΔspoT and ΔdksA strains before (0 minutes) and during an hour of glucose starvation. N=3. C) 16S rRNA promoter activity in the prototrophic strain (NA1000 pxyl∷pP16Slacz) and the auxotrophic strains (NA1000 ΔgltB pxyl∷pP16Slacz and NA1000 ΔpheA pxyl∷pP16Slacz) in M2G with and without added glutamate or phenylalanine. The cells were grown up in M2G + glu or M2G + phe + ala, and then washed and resuspended in M2G or M2G + ala and grown in those conditions for two hours before the starvation samples were taken. All data were normalized to the signal from the ruvA amplicon on the same biological sample (N=3). Error bars refer to standard deviation for all experiments.

