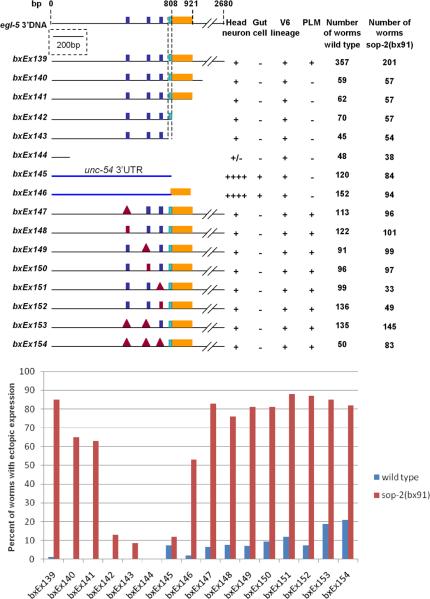
Fig. 2.
Effect of egl-5 3’ DNA sequences on expression of the minimal seam cell reporter. Top: the structure of deletion derivatives of V6CRE-egl-5-3’REG and their expression in several tissues. Bottom: the percent of worms with ectopic seam cell expression in wild type and in a sop-2 mutant background. Dark blue boxes indicate the sites of three potential miRNA binding sequences. Red box indicates the introduction of point mutations within the sequence, red triangle indicates the sequence was deleted. The light blue box indicates the 3’ end of an egl-5 cDNA and the position of a short conserved region (F5, see Figure 3). The yellow box indicates the 113 nucleotide region that causes ectopic expression in a sop-2 background.

