Figure 2.
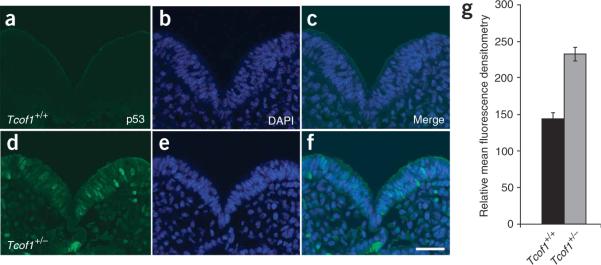
Immunostaining of p53. Immunostaining of E8.5 embryos for p53 protein (green) in Tcof1+/+ embryos (a–c) and inTcof1+/− embryos (d–f). Counterstaining with DAPI (blue; b,e) shows that p53 is specifically stabilized in the nucleus of neuroepithelial cells in Tcof1+/− embryos (f). Scale bar, 40 mm. (g) Bar graph of mean fluorescence denistometry quantification of p53 protein levels in individual neuroepithelial cells of Tcof1+/+ and Tcof1+/− littermates. Statistical significance was determined with the one-tailed Student's t-test with P < 0.001.

