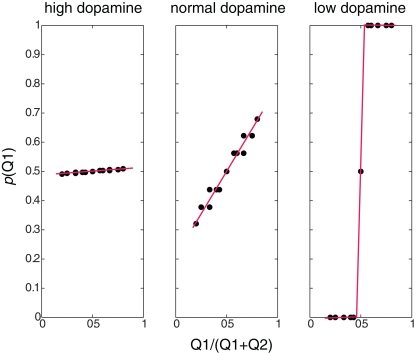
Figure 2.
Behavioral policies at different β/dopamine levels. Probability of choosing Q1 as a function of the ratio between Q1 and (Q1+Q2): high dopamine (low β) – random policy, not dependent on the Q-value, normal (moderate dopamine and β) – policy dependent on the Q-value (preferring higher values), low dopamine (high β) – deterministic (greedy) policy – choosing the higher Q-values, and the dots represent values calculated in the simulation, and the lines are linear curve fittings of these points.

