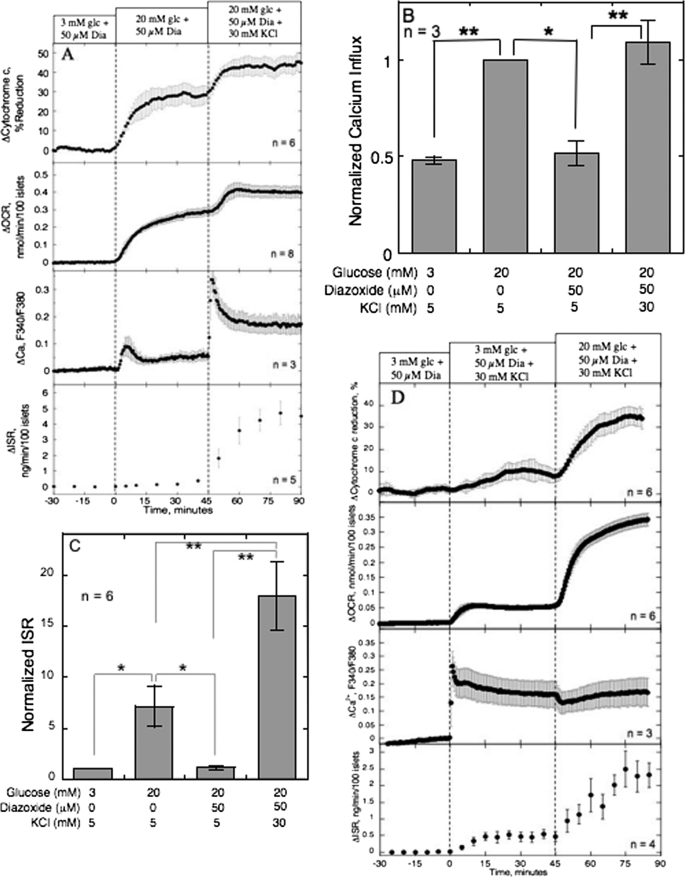
FIGURE 6.
Effect of K+ (30 mm) on cytochrome c reduction, OCR, and ISR and Ca2+ influx, in the presence of 50 μm diazoxide and 20 mm glucose. A, islets were perifused in the presence of 3 mm glucose (glc) and 50 μm diazoxide for 90 min. Diazoxide was present for the duration of the protocol. At time = 0, glucose was raised to 20 mm for 45 min; subsequently, K+ was raised from 5 to 30 mm (at the same time Na+ was lowered by 25 mm). Cytochrome c reduction, OCR, and ISR were measured concomitantly using the flow culture system. Data are displayed and analyzed as described in the legend of Fig. 2. Steady-state values of cytochrome c reduction, OCR, and ISR at 3 mm glucose were 25 ± 4.2% (n = 6), 0.45 ± 0.080 nmol/min/100 islets (n = 8), and 0.12 ± 0.045 ng/min/100 islets (n = 5), respectively. Normalized 45Ca2+ influx (B) and static ISR (C) were measured in response to activation by 20 mm glucose, or 30 mm KCl, in the absence or presence of diazoxide (50 μm). Statistical significance compared with 20 mm glucose or 20 mm glucose plus diazoxide were denoted with: *, p < 0.05, and **, p < 0.01. D, islets were perifused as described in A except that K+ was raised from 5 to 30 mm prior to switching to 20 mm glucose. Steady-state values of cytochrome c reduction, OCR, and ISR at 3 mm glucose were 26.6 ± 2.1% (n = 6), 0.20 ± 0.02 nmol/min/100 islets (n = 6), and 0.03 ± 0.02 ng/min/100 islets (n = 4), respectively.

