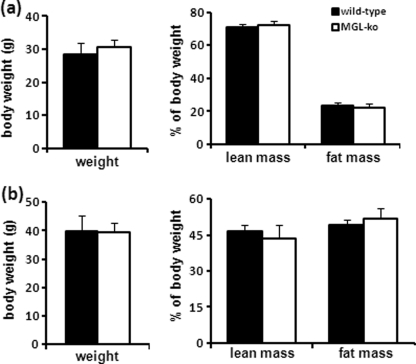
FIGURE 8.
MGL-ko exhibit normal weight, lean, and fat mass. Lean and fat mass of mice were analyzed by NMR (the minispec, NMR Analyzer, Bruker, Ettlingen, Germany). a, weight, lean, and fat mass of male mice on a normal chow diet at the age of 3 months (n = 6 per genotype); b, male mice at the age of 18 weeks fed a high fat diet or for 12 weeks (n = 10 and 11 for wild-type and MGL-ko mice, respectively). Data are presented as mean ± S.D.

