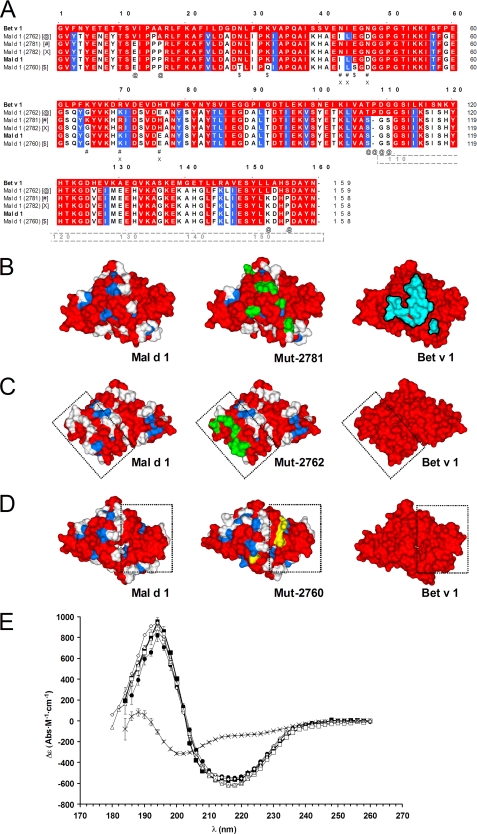
FIGURE 3.
A, B, C, and D, amino acid residues identical with residues in Bet v 1 or conservatively substituted are shown in red and blue colors, respectively. A, amino acid sequence alignment of Bet v 1, Mal d 1, and mutated variants. Symbols #, X, @, and $ mark positions of introduced point mutations in Mut-2781, Mut-2782, Mut-2762, or Mut-2760, respectively. Amino acid residue positions in Bet v 1 are shown with numbers above aligned sequences. For the C-terminal part of Mal d 1, residue positions are shown below aligned sequences. B, modeled molecular surfaces of Mal d 1, Mut-2781, and Bet v 1 (front views). Green color shows the positions of six introduced point mutations in Mut-2781 that increases surface similarity to Bet v 1 within (five mutations) and around (1 mutation) the epitope defined by the BV16 antibody. C, modeled molecular surfaces of Mal d 1, Mut-2762, and Bet v 1 (back views). Frame marks Patch 4 previously defined in Fig. 1B. Green color shows the positions of eight introduced point mutations in Mut-2762 that increases surface similarity to Bet v 1 within Patch 4. D, modeled molecular surfaces of Mal d 1, Mut-2760, and Bet v 1 (front views). Frame marks Patch 2 previously defined in Fig. 1A. Yellow color shows the positions of three introduced point mutations in Mut-2760 of which two mutations decrease surface similarity to Bet v 1 within Patch 2. E, CD spectra. All spectra of mutated molecules Mut-2781 (□), Mut-2762 (Δ), and Mut 2760 (♢) recorded at 15 °C are similar to spectra of wild type molecules rBetv 1 (●) and rMal d 1 (▴) recorded at 15 °C that are different from the spectrum of denatured rBet v 1 (×) recorded at 90 °C.

