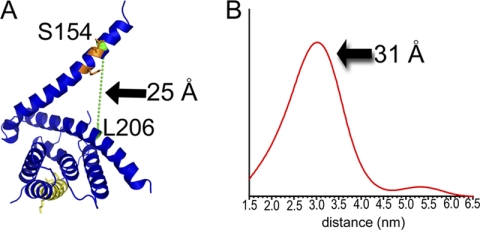
FIGURE 2.
Distances between the spin label pair L206C/S154C computed via DEER/pulsed EPR studies. A, ribbon diagram showing the locations of spin labels L206C and S154C (green) and the distance between β-carbons. The UIM is shown in yellow, and PP2Ac-binding residues are shown in orange. B, distance distribution profiles corresponding to the best fit (shown in supplemental Fig. 1, A and B), showing a major distance distribution of ∼31 Å compared with ∼25 Å in the crystal structure.

