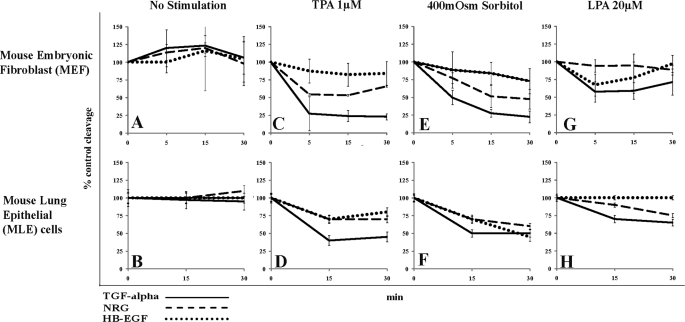
FIGURE 1.
Comparison of pro-EGF ligand cleavage in MEF and MLE cells. Cleavage of pro-EGF reporter ligand was detected by changes in the cellular red:green fluorescence ratio as measured by FACS (details see text). Red:green fluorescence ratio was plotted over time and compared with % control in MEF cells or MLE cells stably overexpressing precursors of either TGFα (solid lines), NRG (dashed lines), or HB-EGF (dotted lines). MEF or MLE cells were either left unstimulated (A and B) or were incubated with 1 μm TPA (C and D), 400 mosm sorbitol (E and F), or 20 μm LPA (G and H) and monitored by FACS at indicated time points. Data are from at least three independent experiments performed in triplicate. Data from MLE cells were published previously (11) and are included here to make comparison of the data sets easier.

