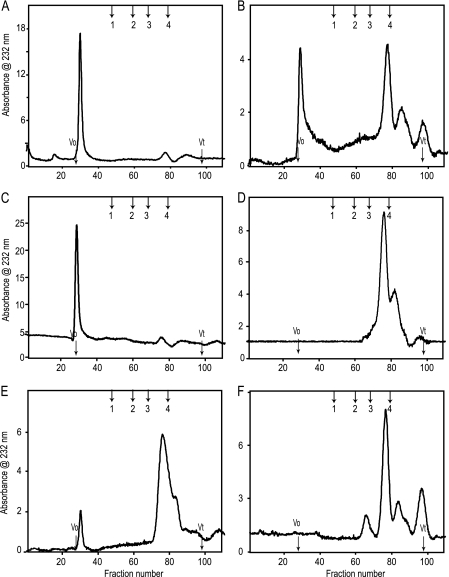
FIGURE 2.
Bio-Gel P10 size exclusion chromatography profiles of male and female liver HS after cleavage with heparinase I, heparinase II, or heparinase III. A, male liver HS after digestion with heparinase I; B, female liver HS after digestion with heparinase I; C, male liver HS after digestion with heparinase II; D, female liver HS after digestion with heparinase II; E, male liver HS after digestion with heparinase III; F, female liver HS after digestion with heparinase III. The columns void (V0) and total (Vt) volumes were determined using hemoglobin and sodium dichromate, respectively. The column was calibrated using even-numbered heparin oligosaccharides derived from heparin. The enzyme-digested peaks were identified by the elution positions of the known heparin oligosaccharides. The arrows indicate the elution positions of heparin oligosaccharide standards (1, dp10; 2, dp6; 3, dp4; 4, dp2).

