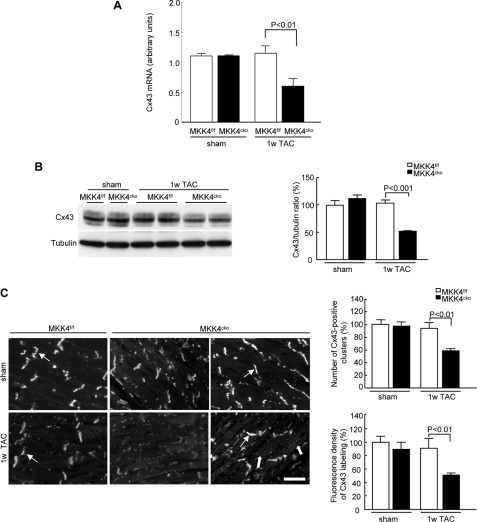
FIGURE 3.
Reduced and spatially heterogeneous distribution of Cx43 in MKK4cko-TAC mice. A, quantitative real-time PCR analyses of Cx43 transcript levels. The data are derived from three independent experiments performed in triplicate and are normalized to the GAPDH content (n = 5 per group). B, immunoblot analyses demonstrate significantly decreased Cx43 content. Tubulin expression is the protein loading control. The ratios of Cx43/tubulin are represented by the bar graphs (n = 6 per group). C, immunohistochemical staining of Cx43 in MKK4cko mice. Thick arrows point to diffuse Cx43 labeling in the cytoplasm, whereas thin arrows show Cx43 distributed in intercalated discs. Scale bar, 5 μm. The number of Cx43-positive clusters and fluorescence intensity of Cx43 labeling are quantified and expressed by the bar graphs (n = 6 per group). Data are mean ± S.E. 1w TAC, 1-week TAC.

