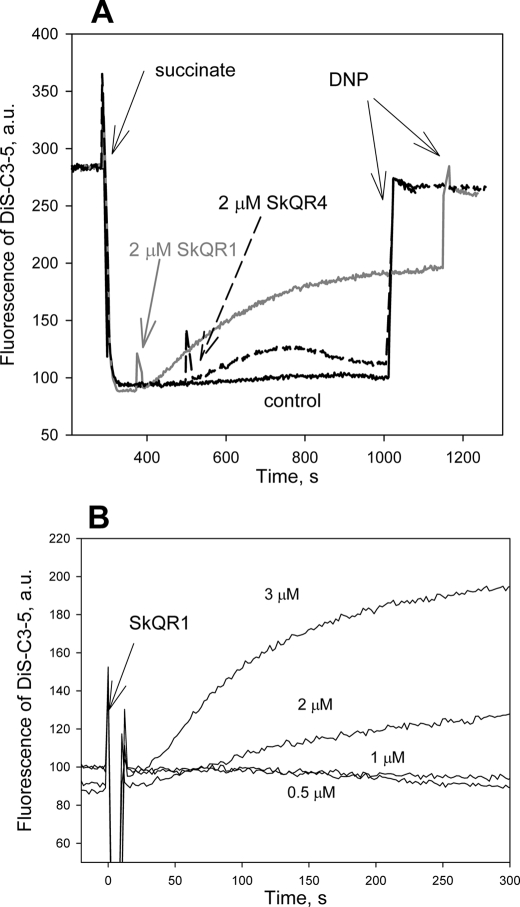
FIGURE 3.
A, effect of SkQR1 and SkQR4 on the membrane potential of rat liver mitochondria measured by DiS-C3-(5). Shown are traces of fluorescence in the medium described under “Materials and Methods.” In all traces, 5 mm succinate and 1 μm rotenone were added at 300 s, and 100 μm DNP was added at the end of each trace. Control, no other additions. Gray trace, 2 μm SkQR1 was added at 380 s. Dashed trace, 2 μm SkQR4 was added at 500 s. B, dose dependence of the effect of SkQR1 on the potential of mitochondria. a.u., arbitrary units.

