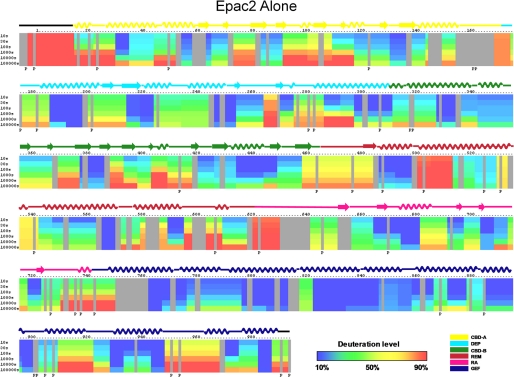
FIGURE 3.
Amide H/D exchange profiles of apo-Epac2. The percentages of deuteration levels of each peptide fragment at various time points are shown as a heat map color-coded from blue (<10%) to red (>90%), as indicated at the bottom right of the figure. Each block represents a peptide segment analyzed at each of the six time points (from top to bottom: 10, 30, 100, 1,000, 10,000, and 100,000 s). Proline residues, and regions with no amide exchange data available are colored in gray. Three independent DXMS analyses were performed. Standard deviations of deuterium incorporation were 2.5% or less between replicates.

