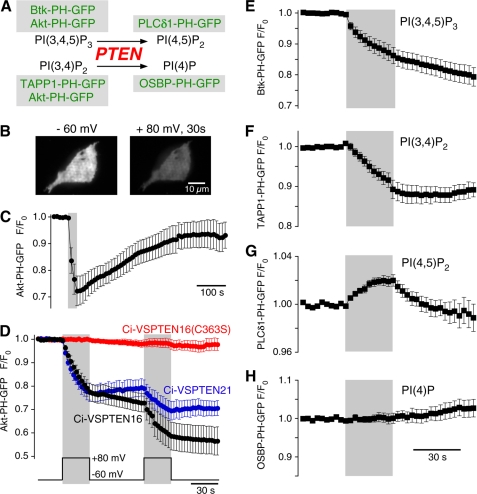
FIGURE 2.
Ci-VSPTEN displays voltage-activated lipid phosphatase activity. A, schematic representation of the enzymatic activity of PTEN, a 3′-phosphatase that converts PI(3,4,5)P3 into PI(4,5)P2 and PI(3,4)P2 into PI(4)P. GFP-fused sensor domains used in this study to detect concentration changes of the putative substrates and products of Ci-VSPTEN chimeras are indicated (green). B, TIRF images of a living CHO cell coexpressing the PI(3,4,5)P2/PI(3,4)P2 sensor Akt-PH-GFP and Ci-VSPTEN16 together with constitutively active PI3K p110αK227E (PI3K). Images were acquired before (left) and after 30 s of depolarization to +80 mV (right) in whole-cell configuration. Depolarization-induced loss of fluorescence results from reduced membrane association of Akt-PH and indicates depletion of 3′-phosphoinositides. C, depolarization-induced translocation of Akt-PH as in B is followed by slow recovery, indicating resynthesis of 3′-phosphoinositides by PI3K (recordings obtained with perforated patch configuration). The gray area indicates depolarization from −60 to +80 mV. D, normalized TIRF intensities in response to repetitive depolarization obtained as in B. Cells coexpressed Akt-PH-GFP, PI3K, and the Ci-VSPTEN chimeras indicated (n = 10, 3, and 7 cells, for Ci-VSPTEN16, Ci-VSPTEN21, and Ci-VSPTEN16-C363S, respectively). E–H, depolarization-triggered changes in membrane association of fluorescent probes that specifically bind various phosphoinositides, measured as in D. Cells expressed Ci-VSPTEN16 together with PI3K and either Btk-PH-GFP (n = 16), TAPP1-PH-GFP (n = 5), PLCδ1-PH-GFP (n = 6), or OSBP-PH-GFP (n = 6). Error bars indicate S.E.

