FIGURE 3.
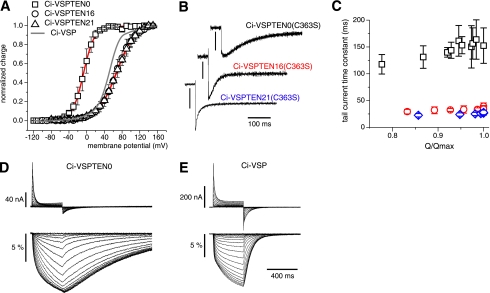
Effect of the PBM on the voltage sensor dynamics. A, voltage dependence of the sensing currents of the three Ci-VSPTEN chimeras were measured from Xenopus oocytes (27), using the catalytically inactive mutant C363S (equivalent to C124S in PTEN). Normalized Q-V curves were derived from the OFF sensing currents at −90 mV following a 400-ms step to the potentials indicated. The gray curve shows the voltage dependence of Ci-VSP-C363S recorded under the same conditions (27). Fits of a two-state Boltzmann distribution to the data (continuous red lines) yielded potentials at half-maximal charge transfer of −7 ± 0.2 mV (n = 4), +67 ± 0.4 mV (n = 3), and +69 ± 0.3 mV (n = 4), with charges of 2.0 ± 0.03 e0, 1.2 ± 0.02 e0 and 1.1 ± 0.01 e0, for Ci-VSPTEN0, Ci-VSPTEN16, and Ci-VSPTEN21, respectively. B, OFF sensing currents of Ci-VSPTEN chimeras measured at −90 mV following a 400-ms test pulse to 0 mV for Ci-VSPTEN0 and +100 mV for Ci-VSPTEN16 and Ci-VSPTEN21. Current scale bars, 50 nA, 250 nA, and 100 nA, respectively. C, Weighted mean time constants of tail-sensing currents recorded as in A are shown for the nearly saturating region of the Q-V curves (Q/Qmax > 0.75; n = 5) for Ci-VSPTEN (black), Ci-VSPTEN16 (red), and Ci-VSPTEN21 (blue). D and E, sensing currents and changes in fluorescence intensity (ΔF/F0) from tetramethylrhodamine-5-maleimide-labeled Ci-VSPTEN0-G214C-C363S (D) and Ci-VSP-G214C-C363S (E) in response to depolarizing voltage steps (−120 to 140 mV).

