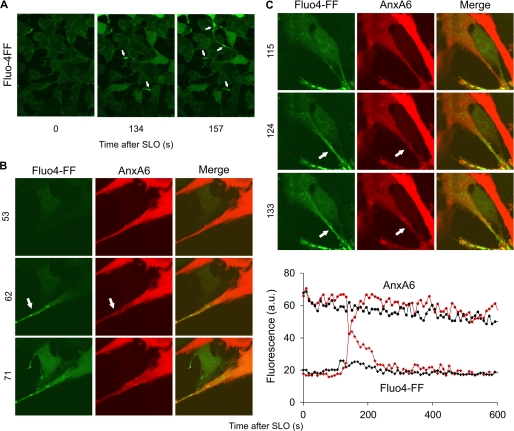
FIGURE 7.
Localized intraprotrusion [Ca2+]i elevation accompanied by spatially restricted translocation of annexin A6. A, HEK 293 cells loaded with Ca2+-sensitive dye Fluo-4-FF were challenged with SLO (50 ng/ml) at time point = 0. Arrows denote cellular protrusions with elevated [Ca2+]i. B and C, U373MG cells transfected with annexin A6 (AnxA6)-mCherry and loaded with the Ca2+-sensitive dye Fluo-4-FF were challenged with SLO (50 ng/ml) at time point = 0. Arrows denote cellular protrusions with elevated (relative to the cell body) [Ca2+]i. Note the simultaneous translocation of annexin A6 within the protrusions. The graph in C shows changes in Fluo-4-FF fluorescence (Fluo4-FF, red and black diamonds) and annexin A6-mCherry fluorescence (Anx6, red and black circles) in the cytoplasm of the protrusion (red symbols) and in the cytoplasm of the cell body (black symbols). The transient drop in the annexin A6 fluorescence within the protrusion (red circles) is due to its transient translocation to the plasmalemma in response to the spatially and temporary restricted [Ca2+]I elevation (red diamonds). a.u., fluorescence intensity units.

