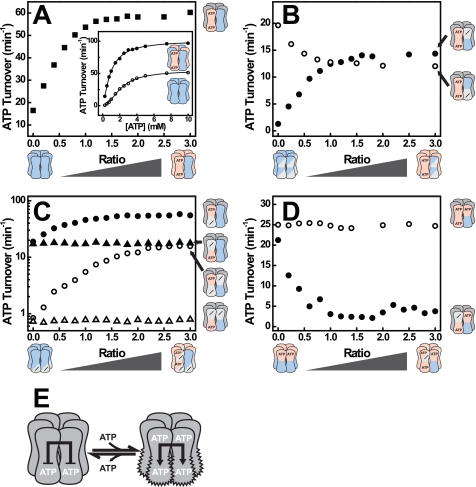
FIGURE 2.
ATP binding to NBD1 stimulates ATP hydrolysis in an adjacent NBD2. A, ATPase activity of [++] mixed with [bb] at various ratios (■). Inset, ATPase rate plot of [++] (○) and a [bb·++] mixture at a ratio of 1 (●). B, ATPase activities of [−+] (●) and [+−] (○) mixed with [bb] at the indicated mixing ratios. C, ATPase activities of [++] (filled symbols) and [−+] (open symbols) mixed with [−b] (triangles) or [b−] (circles) at the indicated ratios. D, ATPase activity of [b+] mixed with [bb] (○) or [−b] (●) at the indicated ratios. E, model of Hsp104 showing the stimulatory effect of ATP binding to NBD1 on ATP hydrolysis in NBD2. ATP hydrolysis rates were determined at 30 °C and 2 mm ATP. The concentration of active subunits was 1 μm, whereas the concentration of inactive subunits varied. Hetero complexes were formed by mixing both subunits in the absence of nucleotide and incubation for 1 h at 30 °C prior to measurement.

