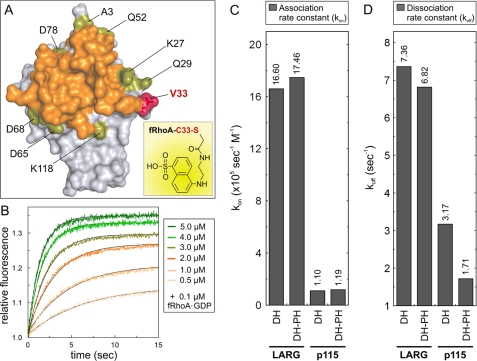
FIGURE 4.
Real time monitoring of RhoGEF interactions with GDP-bound fRhoA. A, RhoA labeling strategy with the fluorescence reporter group AEDANS (inset). The van der Waals surface of nucleotide-free RhoA from the LARG DH-PH complex (17) (Protein Data Bank code 1X86) shows the solvent-accessible surrounding residues (green) around the interaction surface of LARG (orange). Valine 33 (V33) of RhoA substituted by cysteine and labeled with AEDANS (fRhoA) is shown in red. B, fRhoA allows monitoring of the RhoGEF association in real time. Rapid mixing of increasing p115 DH-PH concentrations (0.5–5 μm) with fRhoA-GDP (0.2 μm) resulted in an incremental increase in fluorescence corresponding to the association reaction. C, the association rate constants (kon) of fRhoA-GDP binding to the DH and DH-PH proteins of LARG and p115, respectively, clearly revealed differences in the binding properties of the two RhoGEFs. D, the dissociation rate constant (koff) of the DH and DH-PH proteins of LARG and p115, respectively, displaced from the fRhoA-GDP complex in the presence of excess amounts of unlabeled, nucleotide-free RhoA revealed an impact of p115 PH domain on the GEF dissociation kinetics. The kinetic data are shown in supplemental Fig. S3. The dissociation constant (Kd) was calculated from the kinetic parameters of dissociation and association reactions by the equation Kd = koff/kon. For convenience, the exact kon and koff values are given as numbers above the bars in C and D, respectively.

