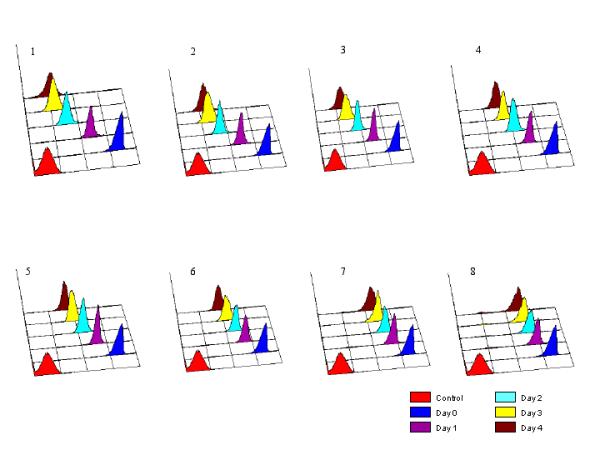
Figure 2.

Single parameter histograms of CFSE fluorescence of p-229 promastigotes exposed to 4, 10, 50, 100, 200, 400 and 800 μg/ml allopurinol (panels 2-8, respectively; panel 1, unexposed control). X-axes, CFSE fluorescence intensities (four log scale).
