FIGURE 3.
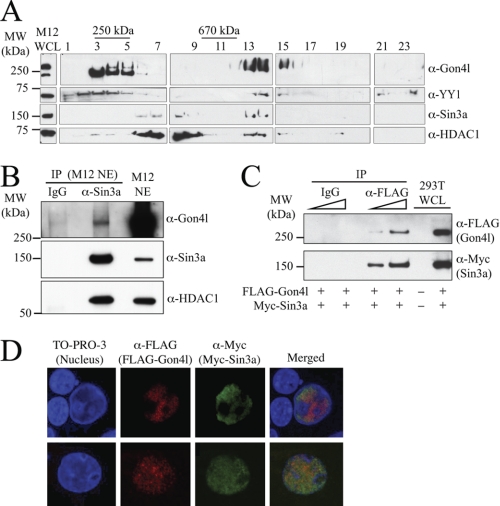
Gon4l interacts with the transcriptional co-repressor Sin3a and its functional partner HDAC1. A, co-sedimentation of Gon4l, YY1, Sin3a, and HDAC1 in sucrose density gradients. WCLs from M12 cells were loaded onto the top of a 20–50% sucrose gradient. After centrifugation, the fractions indicated across the top of the panel (odd numbers only are shown) were collected and analyzed by immunoblot using the antibodies listed on the right side of the panel. M12 WCL was used as a positive control for immunoblots (left side of panel). Protein standards were separated in parallel gradients, and fractions containing these are indicated at the top of the panel. The data shown are representative of at least three independent experiments. B, co-immunoprecipitation of Gon4l, Sin3a, and HDAC1 from M12 cell nuclear extracts (NE). Sin3a antibodies and nonspecific IgG were used to IP proteins from M12 NE. Recovered material was immunoblotted with antibodies specific for Gon4l (top panel), Sin3a (middle panel), or HDAC1 (bottom panel). M12 NE was used as a positive control for immunoblots. C, co-immunoprecipitation of FLAG-Gon4l and Myc-tagged Sin3a (Myc-Sin3a) expressed in transfected 293T cells. Anti-FLAG and nonspecific IgG were used to immunoprecipitate proteins from 293T WCLs. Recovered material was immunoblotted with antibodies specific for the FLAG or Myc epitopes to detect FLAG-Gon4l (top panel) and Myc-Sin3a (bottom panel), respectively. The wedges at the top of the blots signify that serially increased amounts of sample were loaded. 293T WCLs were used as control for immunoblots. D, co-localization of Gon4l and Sin3a in the nucleus. The images shown were obtained by immunofluorescent confocal microscopy of 293T cells expressing FLAG-Gon4l and Myc-Sin3a from transfected plasmids. 293T cells transfected with expression plasmid lacking a cDNA insert were used as a control (data not shown). The cells were stained with anti-FLAG and anti-Myc antibodies and then with the nuclear stain TO-PRO-3 as noted at the top of the panel. Yellow color in the merged images signifies co-localization of FLAG-Gon4l and Myc-Sin3a. The upper and lower sets of panels are each from an independent experiment. All of the data shown are representative of at least three independent experiments. MW, molecular mass.

