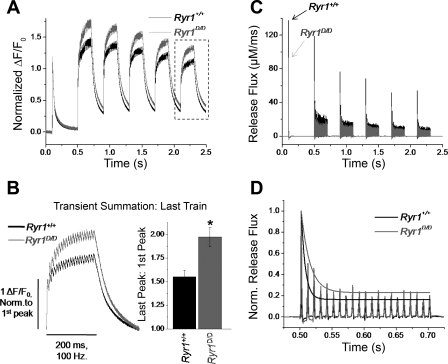
Fig. 9.
Ryr1D/D muscle fibers demonstrate summation of AP-evoked Ca2+ transients and slower inactivation of sarcoplasmic reticulum (SR) Ca2+ release flux during tetanic stimulation. A: average Fluo-4 transient responses of 7 control and 10 mutant fibers to a single AP stimuli followed by 5 repeats of 200 ms trains of 100 Hz stimuli, with 200 ms recovery between trains. Traces are normalized to the amplitude of the first transient to demonstrate differences in transient summation during repetitive stimulation. B, left: boxed traces from A, time expanded and normalized to amplitude of the initial peak to examine transient summation of last train. Right: quantification of transient facilitation between Ryr1+/+ and Ryr1D/D fibers (*P < 0.01, Ryr1+/+ n = 7, Ryr1D/D n = 10). C: average SR Ca2+ release flux of control and mutant fibers, quantified using a Ca2+ removal model to calculate release from fluorescence responses of fibers subjected to stimulation paradigm seen in A. Release flux is suppressed in mutant fibers compared with controls. D: representative SR Ca2+ release flux time course of first tetanic train in C from a control and mutant fiber, normalized to amplitude of initial flux. Peaks of release flux are fit to a single exponential function to quantify inactivation of release during the train. Tau of inactivation is significantly increased in Ryr1D/D fibers, suggesting a slower rate of inactivation. Fractional inactivation was not significantly different between the groups.

