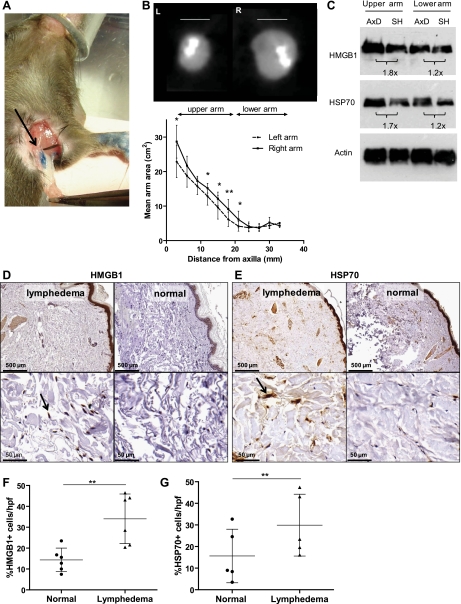
Fig. 7.
Endogenous danger signal expression is upregulated after axillary lymph node dissection. A: gross image of axillary lymph nodes (arrow) and axillary fat pad resected following distal injection of blue dye in paw. B: axillary dissection (AxD) was performed in the right axilla and sham operation (SH) in the left axilla (n = 8); arm areas were determined from consecutive transverse CT slices as represented. Areas were determined every 3 mm starting 5 mm from the axilla and graphed according to distance distal to the axilla; bars represent means ± SD, *P < 0.05, **P < 0.01. C: Western blot analysis of HMGB1, HSP70, and actin expression from tissues of upper and lower arms (AxD, Axillary dissection; SH, sham). ImageJ analysis of fold-change in band density is displayed below blots. All blots were performed in at least triplicate. D and E: representative HMGB1 and HSP70 immunohistochemical staining of matched human punch biopsy specimen obtained from lymphedematous (left) and nonlymphedematous (right) contralateral limbs (n = 6); representative low (×5, top) and high power (×50, bottom) views are displayed. Arrow indicates positive cell. F and G: percentage of HMGB1+ or HSP70+ cells per hpf is displayed; bars represent means ± SD, **P < 0.01.

