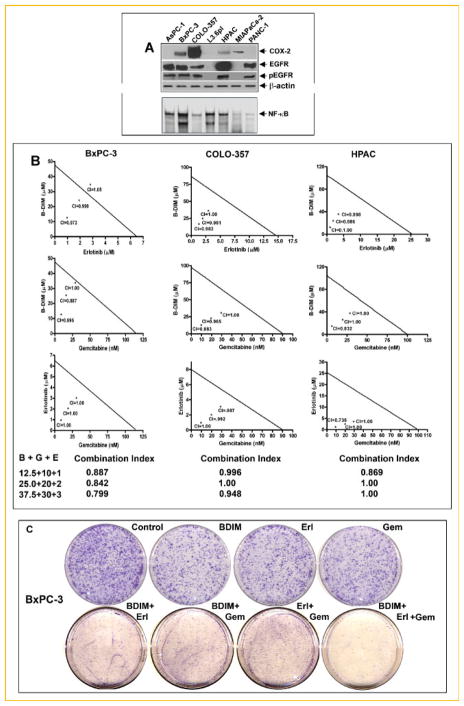
Fig. 2.
The level of COX-2, EGFR, pEGFR, and NF-κB activation was compared between a panel of seven pancreatic cancer cell lines (A). Expression of protein was assayed by Western blot analysis (upper panel), NF-κB activation was evaluated by the EMSA (lower panel). Isobologram plots for combination treatments with B-DIM (12.5, 25, and 37.5 μM), erlotinib (1, 2, and 3 μM), and gemcitabine (10, 20, and 30 nM) in BxPC-3, COLO-357, and HPAC cell line was evaluated by the MTT assay. CI, combination index (B). Cell survival of BxPC-3, cells treated with B-DIM (25 μM), erlotinib (2 μM), gemcitabine (10 nM), and the combinations were evaluated by the clonogenic assay (C). Photo micrographic differences in colony formation in BxPC-3 cell line untreated and treated are shown. [Color figure can be viewed in the online issue, which is available at www.interscience.wiley.com.]

