Fig. 5.
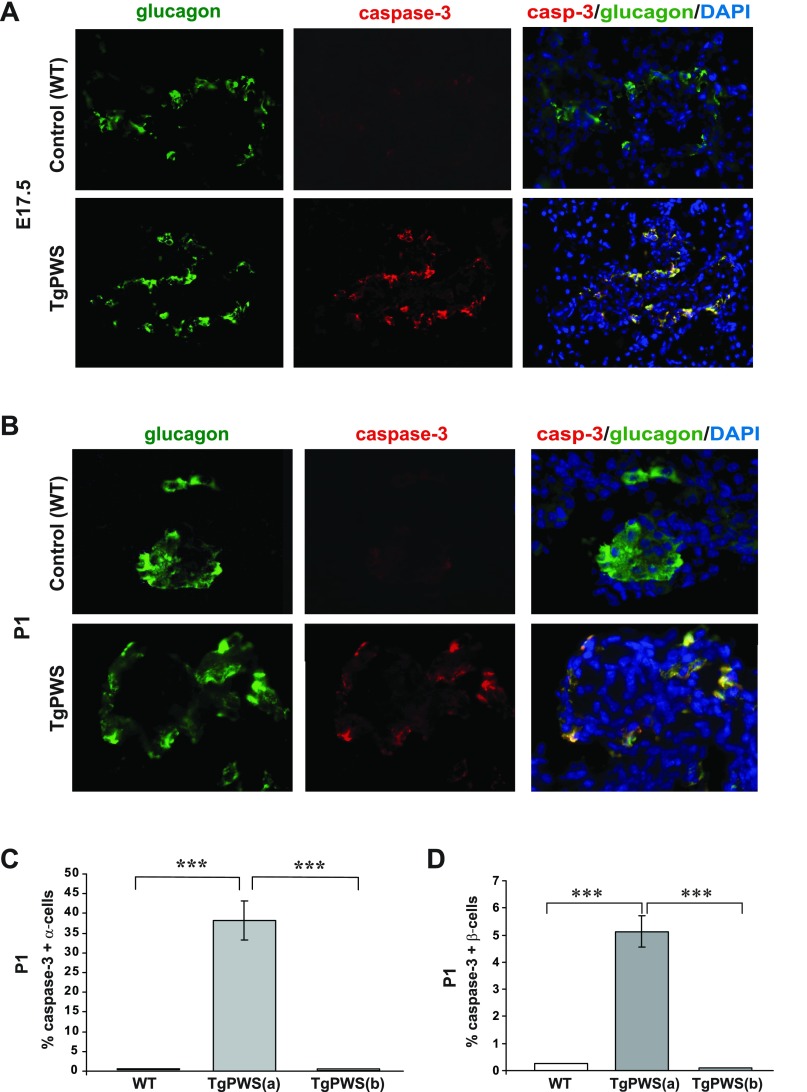
Numerous α-cells and some β-cells undergo apoptosis in TgPWS pancreas at embryonic day 17.5 (E17.5) and P1. A and B: assessment of α-cell apoptosis in TgPWS compared with WT pancreas at E17.5 and P1, respectively, by immunostaining of activated caspase-3 (red) as a marker for apoptosis and glucagon (green) as the marker for α-cells. Cell nuclei were stained with DAPI (blue). A FITC (480/440 nm excitation) filter was used to take images for glucagon, and a tetramethylrhodamine isothiocyanate (TRITC; 535/530 nm excitation) filter was used to take images for caspase-3 immunostained cells. In the merged images, apoptotic α-cells that coexpress glucagon and caspase-3 appear yellow. C: quantification of apoptotic α-cells at P1 presented as a mean percentage of caspase-3-positive α-cells in TgPWS vs. WT islets. Islets in TgPWS were of 2 types, having an average of 38% apoptotic α-cells [17 islets in TgPWS(a)] or no apoptotic cells [8 islets in TgPWS(b)], whereas 11 islets were assessed for WT. D: quantification of apoptotic β-cells at P1 presented as mean percentage of caspase-3-positive β-cells in TgPWS vs. WT islets. Examples of immunostained TgPWS and WT pancreatic sections at P1 and E17.5 are in Supplemental Fig. S1. Islets in TgPWS pancreas at P1 were of 2 types, with 9 islets having an average of 5% apoptotic β-cells [TgPWS(a)] and 9 islets having no apoptotic cells [TgPWS(b)], whereas 12 islets were assessed for WT. ***P < 0.0001, significant differences between TgPWS(a) and WT or TgPWS(b) pancreas (independent t-test).

