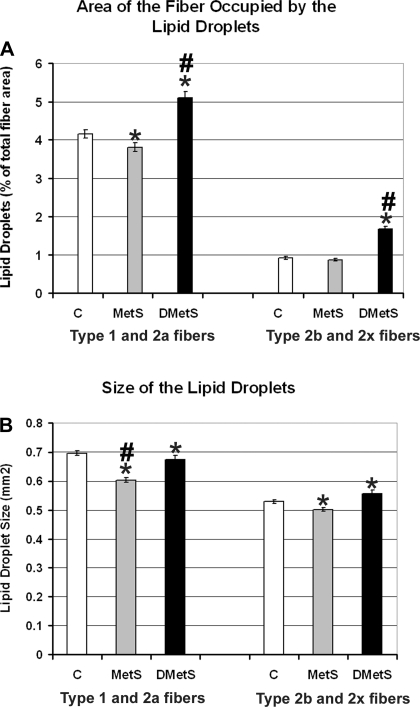
Fig. 7.
Comparison of the fiber areas occupied by the IMCL droplets (A) and IMCL droplet sizes (B) in PLN muscle of the Ossabaw swine on control, MetS, and DMetS diets. *Significant difference between control and MetS and DMetS diet groups according to the t-test. #Significant difference between control and MetS and DMetS diet groups according to the ANOVA.

