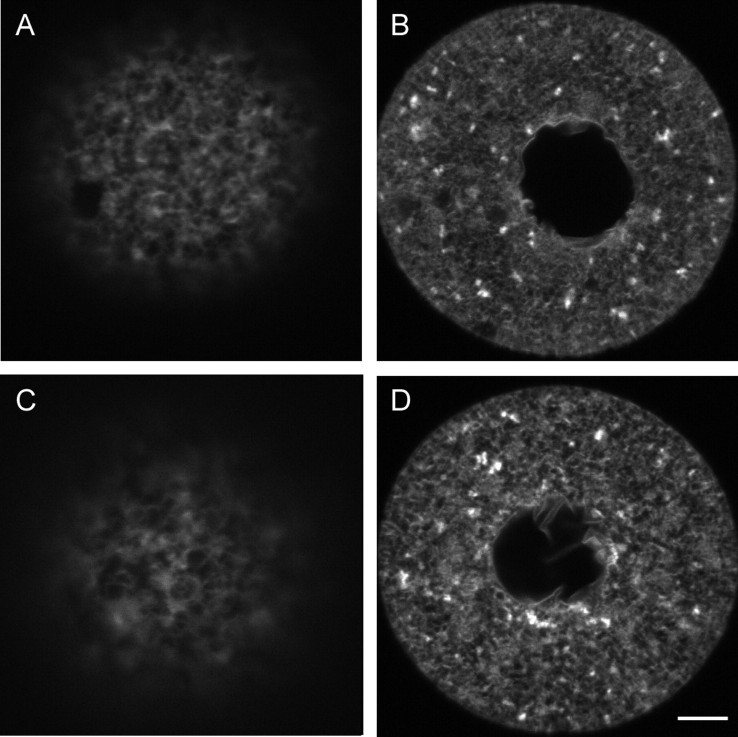
FIG. 5.
The ER structure in GV-stage oocytes. The ER was labeled using the lipophilic fluorescent dye DiI. A and B) Representative photograph from 25 fresh oocytes showing a continuous ER but the absence of cortical ER clusters that are characteristic of MII-stage oocytes [40, 48] in the cortex (A) and equator (B). C and D) Representative photograph from 19 vitrified oocytes showing the absence of cortical clusters in sections of the cortex (C) and equator (D). Bar = 5 μm (A and C) and 10 μm for (B and D).

