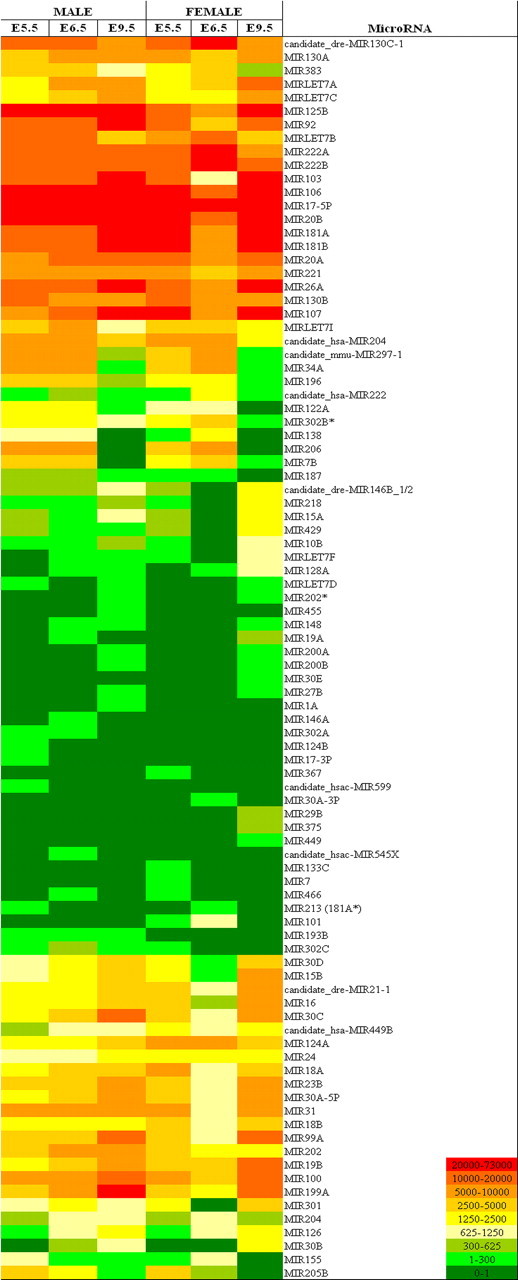
FIG. 1.

The miRNAs expressed in embryonic chicken gonads during sexual differentiation. Heat map displays all 92 miRNAs detected with expression in chicken embryonic gonads from E5.5, E6.5, and E9.5. Expression is color coded to reflect average normalized signal intensity per miRNA, per sex and stage. Males are shown on the left and females on the right. Signal intensity values represented by heat map are given in Supplemental Table S1 under the averages columns.
