Figure 1.
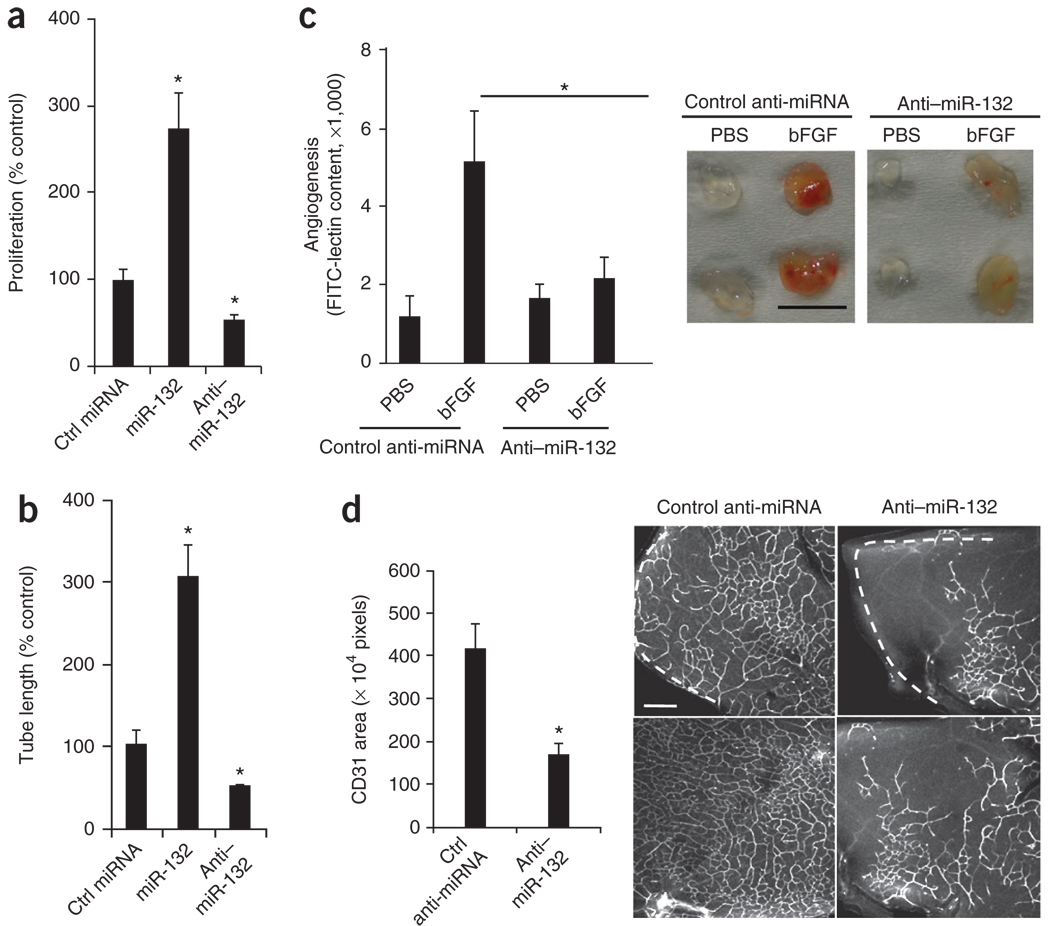
miR-132 regulates growth factor–mediated angiogenesis in vitro and in vivo. (a) HUVEC cell proliferation. After transfection with miR-132 or anti–miR-132 or a control (Ctrl) miRNA, HUVECs were pulsed with BrdU and cell proliferation was measured using an ELISA assay. One representative experiment of three is shown, with the average values of triplicate wells. *P < 0.01 compared to control miRNA. (b) HUVEC tube formation. 24 h after transfection as in a, HUVECs were suspended in a three-dimensional collagen matrix. Tube lengths were measured using MetaMorph software on day 4. One representative experiment of three is shown, with the average values of triplicate wells. *P < 0.01 compared to control miRNA. (c) Angiogenesis in Matrigel plugs in vivo. Growth factor–reduced Matrigel containing either PBS or bFGF was injected subcutaneously into C57BL/6 mice. Mice received 10 µg of either a control anti-miRNA or anti–miR-132 in PBS intravenously (n = 6 per group). Angiogenesis was quantified by measuring FITC-lectin content on day 5. *P < 0.05 for control bFGF plugs compared to anti–miR-132 bFGF plugs. Right micrographs show representative Matrigel plugs from each group. Scale bar, 1 cm. (d) Retinal angiogenesis. Either control anti-miRNA or anti–miR-132 (1 µg) was injected intraocularly into 6-d-old BALB/c pups (n = 5 per group). Retinas were collected and stained with CD31-specific monoclonal antibodies (mAb). Bars show mean CD31 area (n = 25 fields) calculated using MetaMorph software. *P < 0.01. Right micrographs show representative confocal images of the deep plexus retinal vasculature. White dashed lines indicate the periphery of the retinas. Scale bar, 100 µm. Bars show means ± s.e.m.

