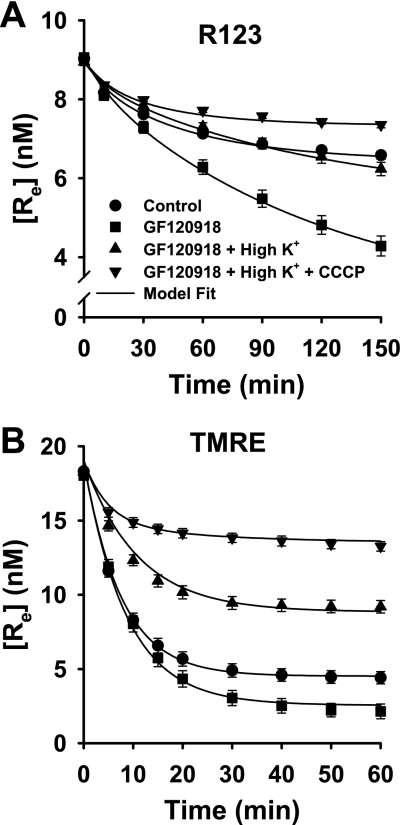
Fig. 4.
Cumulative elimination of processes contributing to dye fate on R123 and TMRE concentrations in medium surrounding cell-coated beads. Symbols are data (means ± SE) for 11 control experiments, 5 experiments with GF-120918, 4 with GF-120918 + high K+, and 4 with GF-120918 + high K+ + CCCP in A and 8 experiments for each condition in B. [Re] data for control and GF-120918 are the same as those in Figs. 2 and 3. Solid lines, model fit to data.

