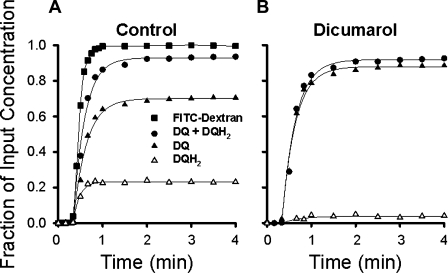
Fig. 3.
Duroquinone (DQ) and hydroduroquinone (DQH2) concentration vs. time lung venous outflow curves following DQ infusion in an NQO1+/+ lung in the absence (A) and presence (B) of the NQO1 inhibitor dicumarol. DQ, DQH2, and DQ + DQH2 concentrations are expressed as fractions of infused pulmonary arterial DQ concentration (50 μM), and FITC-dextran concentration is normalized to infused FITC-dextran concentration.

