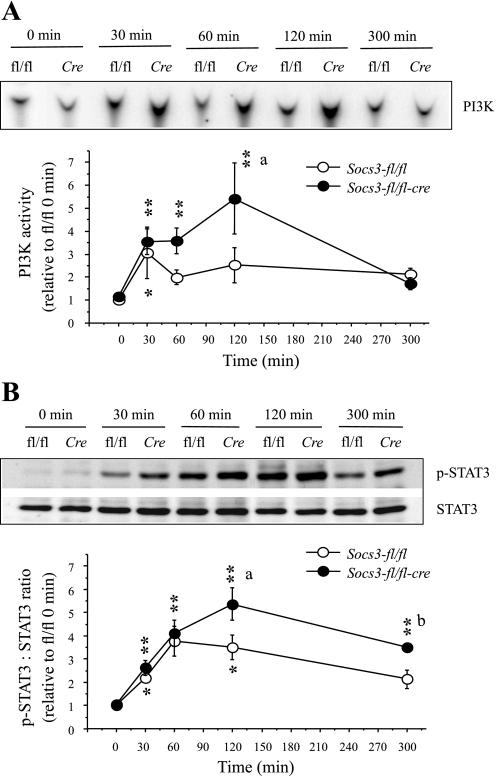
Fig. 2.
Changes in leptin-induced insulin receptor substrate-1 (IRS-1)-associated phosphatidylinositol 3-kinase (PI3K) activity (A) and p-STAT3 levels (B) in the hypothalamus of brain-specific Socs3-deficient (Socs3-fl/fl-Cre) and wild-type (Socs3-fl/fl) mice. A, top: representative phosphor-images obtained from the TLC plate showing phosphatidylinositol 3-phosphate [PI(3)P] production, an indicator of PI3K activity, are shown. A, bottom: results obtained by phosphorimaging showing the changes in PI3K activity. B, top: representative p-STAT3 and STAT3 Western blots obtained from the hypothalamic extract. B, bottom: densitometric analysis of the immunoreactive bands for p-STAT3. The values for p-STAT3 were first calculated as the ratio of STAT3. Values represent the means ± SE for 5–8 animals for PI3K and for 4–6 animals for p-STAT3; and presented as relative to 0 min value of the Socs3-fl/fl group. *P < 0.05 and **P < 0.01 vs. corresponding 0 min values. aP < 0.01 and bP < 0.05 vs. corresponding Socs3-fl/fl group.

