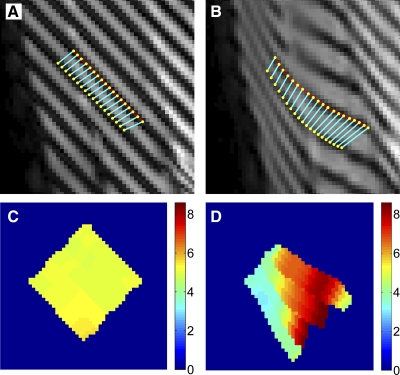
Fig. 4.
Sample curve-matching data during contraction (A) and relaxation (B) and the corresponding distance maps (C and D). After tags were detected, a 1st-order (contraction images) or 5th-order (relaxation images) polynomial was fitted to the detected tags in neighboring tag lines. A robust point-matching algorithm was used to determine the corresponding points on the lines. Distance between the points was measured using the Pythagorean theorem and mapped for visualization of tag distances (C and D). Contraction distance map (C) was homogeneous, as the applied tag distance was 5.08 pixels (7.1 mm). In the relaxation distance map (D), there is intercompartmental heterogeneity in the detected tag distance, as the muscle nonuniformly deformed during relaxation. These data were combined with those from the other tagging directions by axial reformatting of all data.

