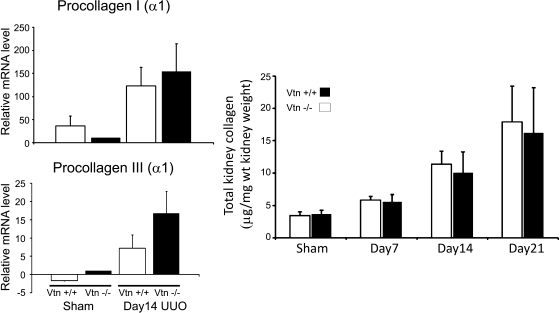
Fig. 7.
Kidney collagen levels are similar in Vtn+/+ and Vtn−/− mice after UUO. Left: kidney collagen I and III mRNA levels measured by real-time RT-PCR (n = 5/group) are significantly increased 14 days after UUO compared with sham-operated kidneys (P < 0.05). The day 14 levels were significantly lower for procollagen III but not for procollagen I. Right: total kidney collagen levels measured using the hydroxyproline assay 7, 14, and 21 days after UUO were similar in the Vtn+/+ and Vtn−/− groups. Results are expressed as means ± 1 SD and are not statistically different between the genotypes at each time point (n = 10–11 UUO mice/group).

