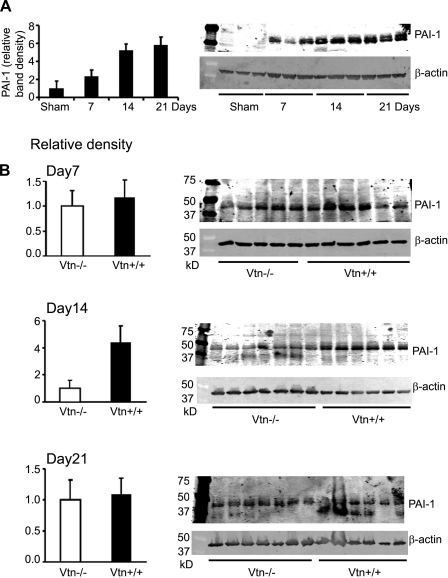
Fig. 9.
Effect of Vtn expression on kidney plasminogen activator inhibitor-1 (PAI-1) levels after UUO. A: representative time course Western blot illustrates the increase in kidney PAI-1 protein levels after UUO. B: comparison Western blots illustrate that kidney PAI-1 protein levels (n = 6–7/group) were similar in Vtn+/+ and Vtn−/− mice at 7 and 21 days while significantly lower in Vtn−/− mice on day 14. *P < 0.05. Each bar graph represents the mean band density ± 1 SD, after correcting for protein loading using the β-actin band density.

