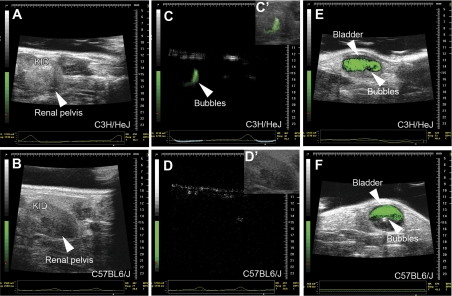
Fig. 2.
Still images of live cystograms in C3H/HeJ and C57BL6/J mice. A and B: fundamental mode ultrasound images showing the kidney (kid) and renal pelvis of C3H/HeJ (A) and C57BL6/J (B) mice at baseline. C and D: subharmonic mode ultrasound images of C3H/HeJ (C) and C57BL/6J (D) mice, depicting reflux of green colorized bubbles into the renal pelvis of the C3H/HeJ mice. C′ and D′: overlay of fundamental and subharmonic mode images confirm that the bubbles are in renal pelvis of C3H/HeJ mice (green) and are absent in the C57BL6/J mice. E and F: overlay of fundamental and subharmonic images confirming the presence of green bubbles in the bladders of both mouse strains. Note the scale bar on the right-hand side of each image.

