Figure 6.
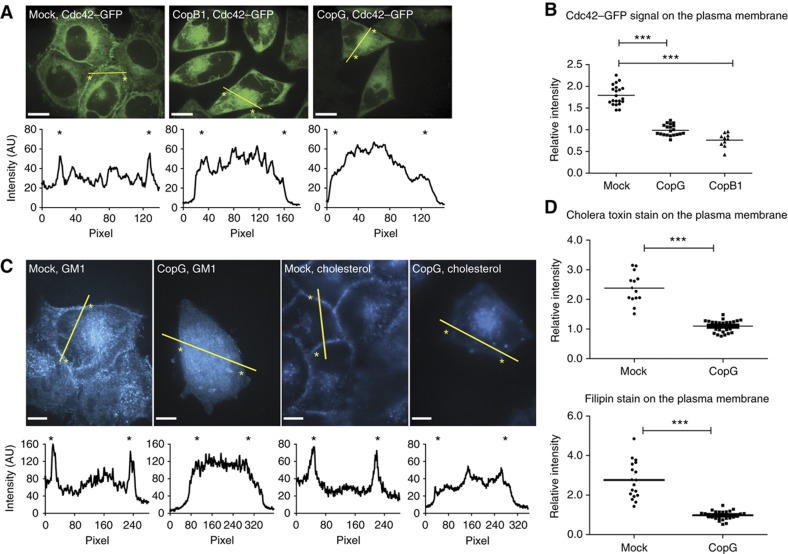
Cdc42, sphingolipid GM1 and cholesterol are mislocalized after depletion of the COPI complex. (A) Confocal images showing the localization of Cdc42–GFP in water-transfected cells (left), cells transfected with siRNA directed against copB1 (middle) or copG (right). The intensity plots along the lines indicated in yellow are shown below the pictures; the position of the membrane is indicated by an asterisk; scale bar=10 μm. (B) Quantification of the Cdc42–GFP signal on the membrane relative to the cytosol (***P<0.005). (C) Confocal images showing the distribution of sphingolipid GM1 (left two panels) and cholesterol (right two panels) in the cells. For each staining, water-transfected cells are shown on the left side and cells transfected with siRNA against copG on the right side; scale bar=10 μm. (D) Quantification of the relative cholera toxin β/filipin staining signal at the membrane compared with the cytosol (***P<0.005).

