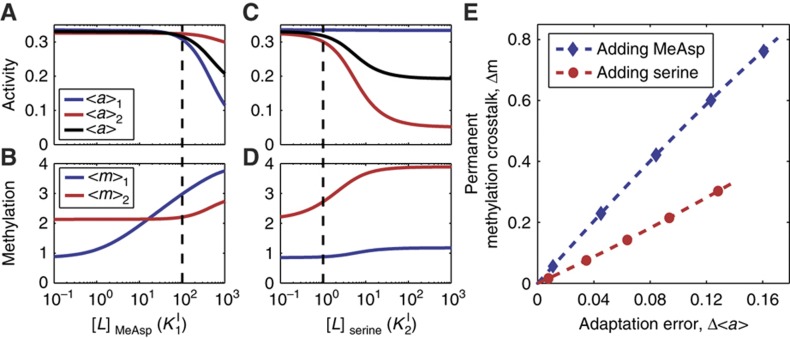
Figure 3.
The steady-state activities, receptor methylation levels and their relationship in different (MeAsp or serine) backgrounds. (A, B) Show the steady-state kinase activities and the receptor methylation levels for different background MeAsp levels. The system can adapt perfectly to very high concentrations of MeAsp (up to [L]1=102K1I). As the Tar methylation level approaches its maximum (boundary) value of 4, adaptation becomes inaccurate (labeled by the dotted line), and the Tsr methylation level starts to increase. (C, D) Show the steady-state kinase activities and the receptor methylation levels for different background serine levels. The perfect adaptation range for serine is much smaller than that for MeAsp, but the general relationship between kinase activity and receptor methylation still holds. As the adaptation becomes inaccurate (labeled by the dotted line), the Tar methylation level starts to increase. (E) Shows the relationship between permanent methylation crosstalk and adaptation accuracy. The blue line is calculated from panels A, B for MeAsp responses, and red line from panels C, D for serine response. The near-linear curves demonstrate strong correlation between permanent methylation crosstalk and adaptation error.

