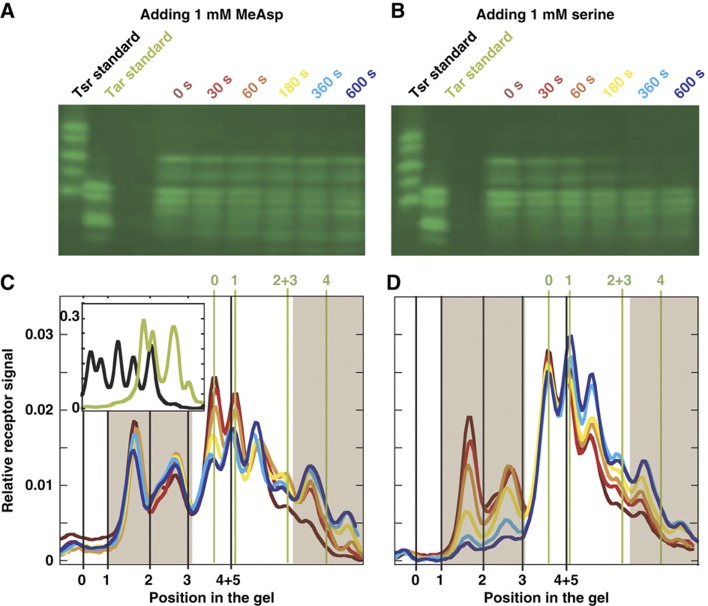
Figure 4.
Direct measurements of receptor methylation dynamics. (A, B) Mobility images of the Tar–Tsr two receptor system on the SDS–PAGE gel after addition of 1 mM MeAsp and serine, respectively. In the images, different columns show the results at specified time points after ligand addition: t=0 s (dark), t=30 s (red), t=60 s (orange), t=180 s (yellow), t=360 s (light blue) and t=600 s (blue). Results from pure Tar and pure Tsr receptors in fixed modification (amidation) states on the same gel are shown in the first two columns of each panel for calibration purpose. (C, D) Curves present relative mobility profiles of receptors on the SDS–PAGE gel measured from panels A, B, respectively: each colored curve corresponds to the column labeled with the same color. Receptors were detected using immunoblotting as described in Materials and methods. Because serine is rapidly metabolized, 1 mM serine was added every minute during incubation. The inset in panel C shows calibration profiles of mixtures of Tar (green) and Tsr (black) receptors. Numbers 0, 1, 2, 3 and 4+5 under the panel boxes (in black) show the positions of Tsr receptor with corresponding number of modifications, and numbers 0, 1, 2+3 and 4 above the panel boxes (in green) are the positions of Tar receptor with corresponding number of modifications. Source data is available for this figure at http://www.nature.com/msb.

