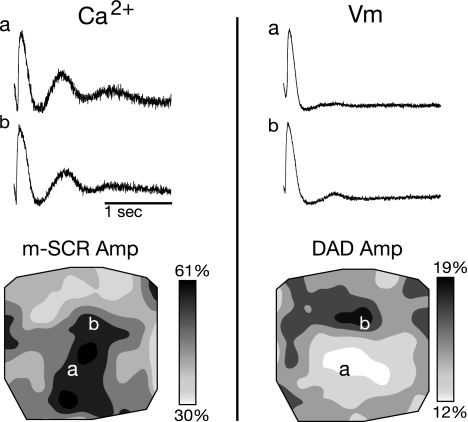
Fig. 5.
Dual calcium and voltage recordings during m-SCR activity. Left, calcium traces recorded during the termination of rapid pacing (top) and a contour map of m-SCR amplitude (bottom). From the same recording, voltage traces (top) and contour map of delayed afterdepolarization (DAD) amplitude (bottom) are shown on right. Evidence of DAD activity is present on the epicardial surface; however, the spatial distribution DAD amplitude is not identical to m-SCR amplitude. Vm, membrane potential.

