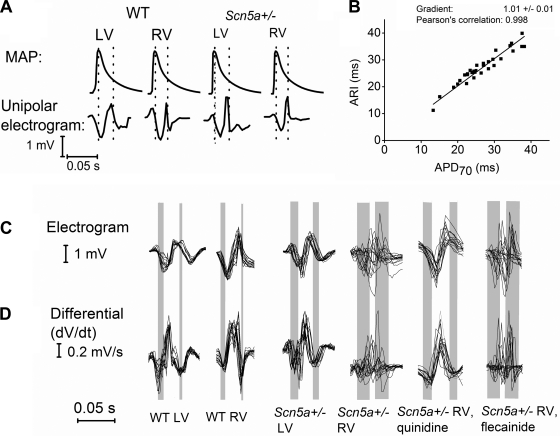
Fig. 2.
A: monophasic action potentials (MAPs) recorded from the base of either LV or RV using a contact MAP catheter and unipolar electrograms recorded using multielectrode mapping. Vertical dotted lines on the MAP tracings denote activation recovery interval (ARI) calculated from the unipolar electrograms. B: graph comparing paired ARI measurements using multielectrode array mapping with action potential duration 70 (APD70) measurements using a MAP electrode at specific locations on the ventricle in individual hearts. C: typical electrograms from the LV and RV of wild-type (WT) and Scn5a+/− hearts and for RV Scn5a+/− traces after addition of quinidine and flecainide. From each 2 × 2 square of the 8 × 8 electrode array grid, a representative trace is shown so that 16 traces are overlaid in each case to provide an indication of the electrical responses over the recording area as a whole. D: differential of each trace, to demonstrate the maximal negative slope dV/dt, from which activation times (ATs) and repolarization times (RTs) were calculated. Vertical bars represent the range of times from first to last activation, and from first to last repolarization. Thus the left edge of the first bar represents the time of the earliest first peak in the dV/dt trace and the right edge of the first bar is the latest first peak in the dV/dt trace. Similarly, the left edge of the second bar is the earliest repolarization peak in the dV/dt trace and the right edge of the second bar is the last repolarization peak in the dV/dt trace. In this way, the bars represent the spatial dispersion of depolarization and repolarization. In each individual trace, the time between activation and repolarization was taken to be the ARI. Thus the interval between the 2 bars gives an indication of the time between activation and recovery of the array as a whole.

