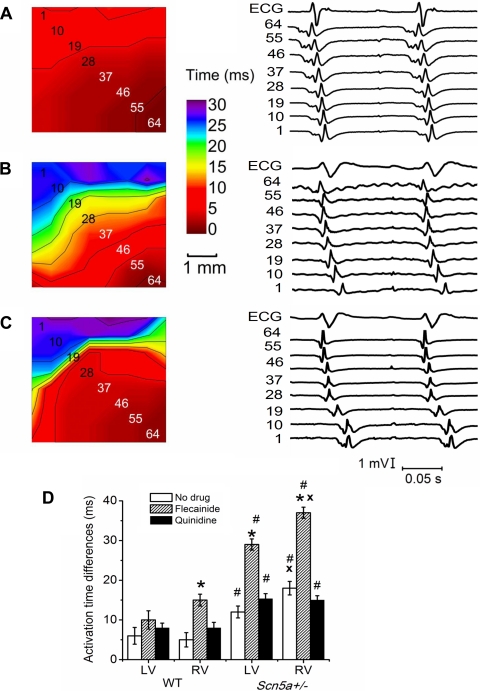
Fig. 3.
A–C: typical isochronal maps for the RV of (A) WT and (B and C) Scn5a+/− hearts. Electrogram numbers correspond to the channel numbers of the array, as shown in the maps. A and B: single planar propagating wavefronts, but with considerably delayed arrival of activation times in B. C: heterogeneities in activation times, with isochronal line crowding. Electrograms are shown for each map along the diagonal axis of the multielectrode array shown by the numbers. D: graph of AT differences. Significant differences: *: effect of drug (i.e., results with flecainide or quinidine compared with those without drug); #: effect of genotype (i.e., Scn5a+/− compared with WT); x: effect of cardiac ventricle (i.e., RV compared with LV).

