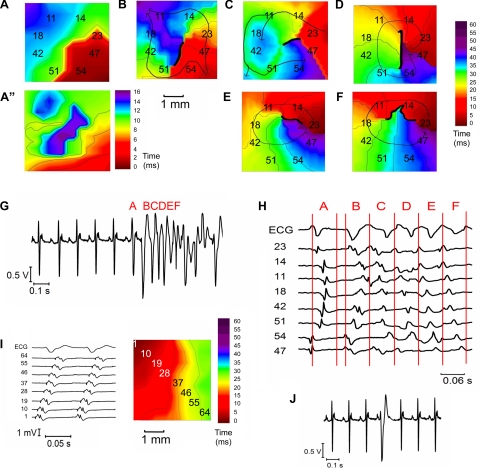
Fig. 4.
A–F: typical isochronal propagation maps in the RV of an Scn5a+/− heart after flecainide treatment, showing ventricular tachycardia (VT) initiation. G: ECG trace showing a ventricular ectopic (VE) initiating a run of polymorphic VT. H: part of the same ECG trace, together with 8 electrogram traces, at the initiation of VT. Electrogram numbers correspond to the channel numbers of the array, as shown in the maps. The portion of electrogram trace delineated by each letter is synchronous with the corresponding propagation map. Thick black lines on the propagation maps denote lines of block. Thin arrows denote lines of propagation. In A, this demonstrates a crowded isochronal lines in the last sinus beat, indicating an area of conduction slowing. A”: repolarization map of the last sinus beat shows increased repolarization heterogeneity in the same area. A premature ventricular beat superimposed on this leads to a line of block with impulse propagation flowing around it (B). C: a second VE results in the formation of a reentrant circuit. D: circuit continues into the next beat to initiate VT. However, the line of block changes, creating a nonstationary vortex, which results in a polymorphic arrhythmia (E and F). I: propagation map, ECG, and electrogram traces of the VT propagating as a wave front across the LV from its onset in the RV. J: ECG trace of a VE occurring after the T wave in an Scn5a+/− heart.

