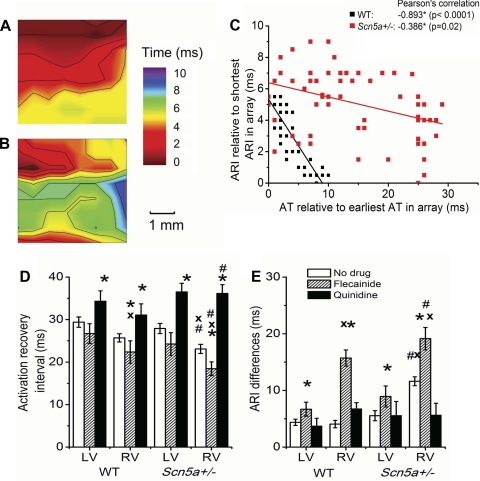
Fig. 5.
A and B: maps of ARIs in the RV of WT (A) and Scn5a+/− (B) hearts from the same runs as Fig. 3, A and B, measured relative to the shortest ARI in the array. C: graph of paired ARI and AT measurements, relative to the shortest ARI or earliest AT in the array, at each of 64 points on the 8 × 8 electrode grid for the experimental runs depicted in Fig. 3, A and B, and Fig. 5, A and B. Graphs of ARIs (D) and ARI differences (E). Significant differences: *: effect of drug; #: effect of genotype; x: effect of cardiac ventricle.

