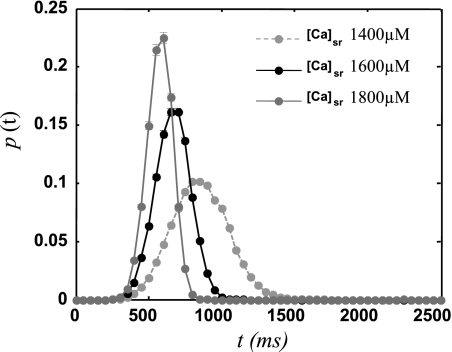
Fig. 4.
First-latency distribution of spontaneous Ca sparks P(t) following an action potential (AP) for 3 different initial SR Ca loads. The time t is measured from the upstroke of the last AP. Here, we have adjusted the sarcomere spontaneous rate Γs to match the experimental measurements of the average latency and SD shown in Table 1.

